
Understanding Audiograms
The Pure Tone Audiogram
-
1. A Basic Measure of Hearing
You may be familiar with pure tone audiograms, the most common representation of auditory sensitivity. Despite their utility, the pure tone audiogram is a crude measure of auditory system performance and should be used in conjunction with other tests.
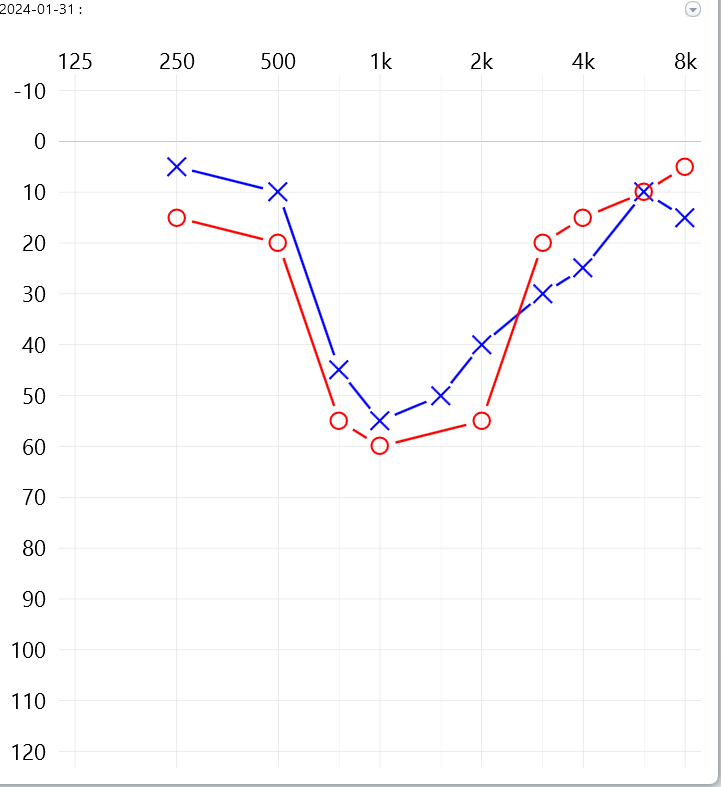
An audiogram shows hearing sensitivity as a function of intensity in decibels HL (y axis) by frequency in hertz (x axis). An audiogram usually covers frequencies that contain the spectral information essential to understanding human speech.
Like other clinics, Audiology First uses the pure tone audiogram as a key component of our test battery. Still, it cannot stand alone as the sole diagnostic tool in hearing assessment. Instead, the pure tone audiogram stands alongside other tests of auditory function to understand the auditory system.
-
2. Audiogram symbols
Symbols used on the audiogram.
O - Right ear air conduction threshold
X - Left ear air conduction threshold
< - Right bone conduction threshold
> - Left bone conduction threshold
△ - Masked air conduction threshold right ear
□ - Masked air conduction threshold
left ear
[ - Right masked bone conduction threshold
] - Left masked bone conduction threshold
R or a Red U- Uncomfortable loudness threshold Right
L - or a Blue U - Uncomfortable loudness threshold Left
A downward arrow from any of these symbols indicates that a threshold was not found, either because the test was unreliable or that equipment limits had been reached.
-
3. Decibel Scales
There are several different variations and versions of decibel scales used in the measurement of the intensity of a sound. As sound is a pressure wave, traveling through air molecules, a common decibel scale used to measure sound intensity is the decibel sound pressure level or dB SPL. While dB SPL is a useful scale for purely acoustic applications, psychoacoustic measurement of hearing sensitivity is measured in decibels Hearing Level, or dB HL.
dB HL and dB SPL differ significantly in that the HL scale has been homogenized to represent a normal ‘zero’ for human hearing at that frequency. An audiogram in dB HL may appear to have a flat X axis, but in fact there is more sound pressure at the low and high frequencies and less sound pressure across the middle of the audiogram. If they were plotted in SPL, average thresholds would appear as U shape rather than a flat line.
The reason for this difference in sensitivity across various frequencies is that the human ear has evolved to be ‘tuned’ for a specific range of frequencies that relate to human communication and environmental awareness.
Audiologists often work back into the dB SPL scale when calculating the sound pressure levels required to correct for various types of hearing loss seen across an audiogram. For example, when fitting a hearing aid, sound pressure levels are measured on an individual basis to ensure the output of the hearing aid is calculated correctly.
This is especially critical for the measurement of hearing and the fitting of hearing aids in children, where using averages for sound pressure level will misrepresent sound pressure levels in the smaller ear canal of a child. See Real Ear Measurements for further information.
-
4. Masking in Audiometry
Obtaining ear-specific results is of critical importance in the measurement of hearing sensitivity.
Masking is a complex set of procedures audiologists use to determine which ear is truly responding to the presented signal.
-
Results in Context
When you receive results from Audiology First, we rely on the cross-check principle; we attempt to reinforce findings with multiple testing methods wherever possible. Reading the audiogram alone is not enough details to make an accurate diagnostic conclusion.